What Is Bitcoin Dominance? Australia 2026 Guide
A plain-English Australia 2026 glossary for bitcoin dominance: what the share measures, how the formula is built, how to read a BTC.D chart, what a rising or falling line usually means, where the metric breaks down, and why it is not advice. Education only — not financial or tax advice.
Quick Answer
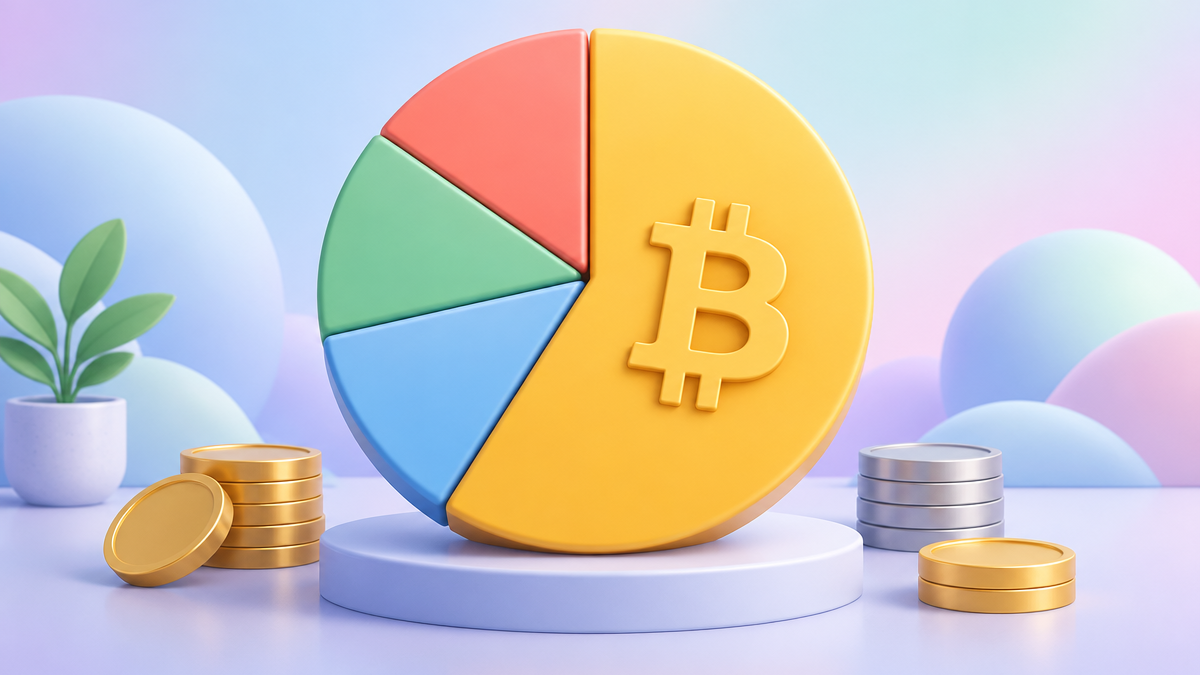
Bitcoin dominance is Bitcoin’s share of the total cryptocurrency market value that a data source chooses to count. In plain English: add up Bitcoin’s market cap, divide by the market cap of the wider basket, and multiply by 100. If Bitcoin were worth 1 unit and the counted market were worth 2 units, the share would be 50 percent — that is an illustration, not today’s reading. The figure is not the price of one bitcoin, not a fear score, and not a signal to buy or sell. Chart sites often plot it as BTC.D. Two sites can disagree because they do not count the same coins. In Australia, looking at the chart is not itself a tax event, and it is not personal financial advice. Education only.
Bitcoin dominance in one screen
Market share, not price
Measures
BTC cap ÷ counted total
Formula
Often labelled BTC.D
Chart
Advice, tax, or sentiment
Not
TL;DR - Quick Takeaways
- Bitcoin dominance is Bitcoin’s share of the crypto market’s total value, not Bitcoin’s dollar price
- The usual formula is Bitcoin market cap divided by the total market cap a data source counts, times 100
- Chart sites often label that share BTC.D; the line moves when Bitcoin or the rest of the market changes
- A rising share can mean Bitcoin is gaining ground, or that other coins are falling faster
- A falling share can mean other coins are growing faster, even if Bitcoin’s own price is up
- Providers do not all count the same coins, so two charts can disagree without either being “the” number
- Dominance is not a buy or sell signal, not personal advice, and not a tax event by itself
- It is a different question from a Fear and Greed index, which tries to score sentiment
- Education only — join the waitlist for Jittie launch updates
Table of Contents
What bitcoin dominance actually means
Bitcoin dominance answers a share question: of the crypto value this chart is counting, how much sits in Bitcoin? People shorten it to BTC dominance, bitcoin market dominance, or the ticker BTC.D. All of those names point at the same kind of ratio. None of them is the spot price of bitcoin in Australian dollars.
That distinction is the whole point of the metric. A coin can be expensive in dollars and still be a small slice of a huge market. A coin can fall in price and still become a larger slice if everything else falls harder. Dominance ignores the “how many dollars is one coin” question and asks “whose share of the pie changed?”
The idea only matters once there is something other than Bitcoin to compare. In the earliest days there were no widely tracked alternatives, so a share figure would have been almost the entire market by default. Once exchanges and data sites listed many assets, traders wanted a single line for “Bitcoin versus everything else.” Everything else is often bundled as altcoins, a loose label for coins that are not Bitcoin. Stablecoins sometimes sit in that “everything else” bucket too, which matters later when you read a falling line.
CoinMarketCap’s glossary describes dominance as Bitcoin’s market capitalisation relative to the total market cap of the digital assets it tracks. That is the plain definition this page uses. It is a description of relative size, not a verdict on whether Bitcoin is “winning,” and not a forecast.
You will also see the same word applied to other assets, such as ether’s share of the market. This glossary is only about Bitcoin’s share. It does not rank coins, and it does not tell you to hold one instead of another.
How bitcoin dominance is calculated
Start with market cap. For a listed coin, market cap is usually the latest price multiplied by circulating supply — the coins the data site treats as available, not every coin that might ever exist. Bitcoin’s market cap is that product for Bitcoin. The denominator is the sum of market caps for every asset the index includes.
The usual formula is:
Bitcoin dominance = (Bitcoin market cap ÷ total crypto market cap in the index) × 100
Worked example, labelled as maths rather than a market update: Bitcoin market cap of 1, total counted market cap of 2, dominance of 50 percent. Change either input and the percentage moves. Double the “everything else” side and the share falls even if Bitcoin’s market cap stays put. Shrink the other side and the share rises even if Bitcoin’s market cap stays put.
Three moving parts therefore matter more than a single headline percentage:
Bitcoin’s price and supply. Price changes move the numerator immediately. Circulating-supply revisions are rarer for Bitcoin than for many newer tokens, but the definition of “circulating” is still a data choice.
Everyone else’s prices and supplies. A rally in large altcoins, a rush into stablecoins, or a new token suddenly counted in the total can change the denominator without Bitcoin doing anything unusual.
The basket itself. This is the quiet one. TradingView’s BTC.D page says a coin’s dominance is its market cap divided by the overall market cap of the top 125 coins, then multiplied by 100. A site that sums a broader list of tokens will not print the same percentage, even in the same hour. Neither figure is a law of nature. When you quote a number, name the source and the day. This article does not publish a live dominance reading.
Stablecoins deserve a separate sentence. They are designed to track a fiat unit, so a wave of people moving from volatile coins into a dollar-tracked token can lift the “non-Bitcoin” side of some indexes. A falling Bitcoin share in that moment may say more about parking in stablecoins than about excitement for another network. Check whether the chart you use includes them before you tell a story about “altcoin season.”
Lost or long-dormant coins are another reason market cap is a blunt tool. Coins that nobody can spend still sit inside many supply figures, so the numerator can include value that is not actually trading. That does not make the ratio useless. It means you should treat it as a rough share of reported value, not as a census of active coins.
How to read a BTC.D chart
A BTC.D chart is a line of that percentage over time. The vertical axis is share, not dollars. A move from a lower share to a higher share means Bitcoin’s slice grew. It does not mean the bitcoin price printed a new high, and it does not mean your portfolio made or lost money.
Read it the way you would read any ratio, with the other half of the ratio in view:
Look at Bitcoin’s own price beside the line. Share up and price up is a different story from share up and price down. The first can mean Bitcoin is leading a rising market. The second often means other coins are being sold harder. The chart of dominance alone cannot tell those apart.
Note the timeframe. A one-day wiggle can be a large coin listing, a supply update, or a thin weekend. A multi-month drift is more likely to reflect where new money went. Neither timeframe is a timetable for what happens next.
Name the index. If the label is TradingView’s BTC.D, remember the top-125 method described on that symbol page. If the label is another site’s “bitcoin dominance,” open their methodology. Switching charts mid-sentence is how people argue about two different pies.
Ignore the temptation to draw a target. Technical-analysis tools can be laid on any line, including this one. A moving average on a market-share series is still just a smoothing of past shares. It does not know why the denominator changed.
A practical reading habit: write one sentence that includes both facts. “Share rose while bitcoin’s price fell” is useful. “Dominance broke out, so alts are done” is a story the chart did not tell you.
What rising and falling dominance usually means
Rising dominance means Bitcoin’s market cap became a larger fraction of the counted total. Common ways that happens:
Bitcoin’s price rises faster than the rest of the basket. Capital is concentrating in Bitcoin relative to other coins. That is sometimes described as a “risk-off” lean inside crypto, because Bitcoin is the older, deeper market — but “risk-off” is an interpretation, not a fact printed on the chart.
Other coins fall faster than Bitcoin. The numerator can be flat or even down, and the share still rises. In that case the line is measuring relative damage, not a Bitcoin rally.
The basket shrinks. If a data site drops tokens, or if illiquid tokens collapse out of a top-N list, the denominator can change for methodological reasons. A one-day jump that lines up with an index reconstitution is not the same event as months of steady share gains.
Falling dominance means the opposite fraction. Other assets, in total, are a larger part of the pie. Common ways:
Altcoins rise faster than Bitcoin. People call stretches like that an altcoin rotation. It can be broad, or it can be a handful of large tokens doing most of the work. Dominance will not show you which.
Bitcoin falls faster than the rest. The share shrinks because the numerator shrank. That is not automatically “good for altcoins” in dollar terms. Everything can be down.
Stablecoin share rises inside indexes that include them. Money leaving volatile coins for a token that tracks a dollar will pad the denominator on those charts.
New assets enter the counted universe. A wider basket makes Bitcoin’s slice look smaller even if nothing was sold.
Hold both directions lightly. Rising does not mean “only buy Bitcoin.” Falling does not mean “sell Bitcoin and buy the rest.” Each move is compatible with several price paths. The honest use is comparative: it stops you treating Bitcoin’s price chart as the whole market.
Limits of the metric
Dominance is popular because it is one number. That is also why it misleads.
It is not activity. Market cap is price times supply. A coin can dominate reported value while very little of it trades, and a smaller coin can dominate today’s volume. Share of value is not share of transactions, users, or fees.
It inherits every flaw of market cap. Circulating supply can be debated. Prices on thin markets can be noisy. Coins that are lost or locked can still be counted. If you would not make a decision from one exchange’s market-cap table alone, do not make it from a ratio of those tables.
The denominator is a product decision. Top 125, “all assets we list,” or “all assets above a volume floor” are different questions. A methodology page is part of the metric. Without it, the percentage is an unlabelled slice.
Stablecoins and wrapped assets can double-count a story. Some tokens represent a claim on another asset. If both the wrapper and the underlying are counted, the pie is partly the same value twice. You do not need to audit every index to remember the risk: the total is only as clean as the list.
It says nothing about why. A lawsuit, a network outage, a listing, an unlocking schedule, or a macro headline can move the line. The chart records the share change. The cause lives in the news, and the news can be wrong too.
Past ranges are not fences. Commentators like to say dominance “always” turns at a familiar level. History is a sample, not a rule. This page does not quote a live level and does not claim a floor or a ceiling.
Used with the price chart and a named methodology, the ratio is a useful map of concentration. Used as a standalone oracle, it is a pie chart with missing ingredients.
Why it is not a buy signal
Search results often mix the definition with trading calls: breakdowns, “altseason,” all-in rotations. Those are opinions about what might happen next. Bitcoin dominance does not issue them.
A signal, if the word means anything strict, needs a rule and a cost when the rule is wrong. “Buy altcoins when dominance falls” fails that test. Dominance can fall because Bitcoin is rising more slowly in a bull market, because Bitcoin is crashing more slowly in a bear market, or because the index added coins. The same squiggle covers opposite portfolios.
Pairing the line with Bitcoin’s price still does not create a recommendation. It only narrows the story from three possibilities toward one. You would still need a view on valuation, time horizon, fees, and what you can afford to lose. This site does not provide that view.
Treat viral chart posts the way you treat any other unsolicited trade idea. Check which index they screenshotted, which date the percentage belongs to, and whether they confused share with price. If they tell you the chart “confirms” a purchase, they have left the definition behind.
Nothing in this guide is an offer to buy or sell Bitcoin or any other asset. Education only.
The Australian angle
Most explainers stop at the formula. Three Australian distinctions are worth keeping separate.
It is not advice. A market-share chart is general information. It is not a personal recommendation, not a statement of opinion about a financial product tailored to you, and not a substitute for advice from someone licensed to give it. Eagle BTM Pty Ltd ACN 659 281 820 publishes this education site and is an AUSTRAC-registered DCE/VASP. AUSTRAC registration is anti-money-laundering registration. It is not an Australian financial services licence, and it is not an endorsement of any coin or any reading of a dominance chart.
It is not a tax event by itself. Opening a BTC.D chart, refreshing it, or arguing about it does not dispose of Bitcoin. You have not sold, swapped, or spent anything by learning the definition. Tax generally becomes a question when something leaves your hands or when you receive crypto as income — for example a sale, a swap into another asset, or spending coins. Record-keeping matters for those events. Dominance does not calculate a gain, a loss, or a cost base, and this page will not invent one. For your own return, use Australian Taxation Office guidance or a registered tax agent.
It is a different question from the Fear and Greed index. Dominance measures market share. A fear-and-greed style index tries to compress sentiment — how fearful or eager a market looks on that publisher’s recipe — into another score. One can be high while the other is low. They are not interchangeable dashboards. We covered a fear-index headline separately in Bitcoin Fear Index Hits Extreme Low: Is a Bounce Coming?. That note is about a sentiment gauge and a bounce narrative. This page does not rewrite it, does not confirm a bounce, and does not treat dominance as a mood ring. Market share is not sentiment.
If you later use an Australian service that converts crypto and dollars, check its registration and what the product actually is. A glossary page is not that check. Jittie is in pre-launch. Join the waitlist for launch updates. This guide stays on the definition.
Frequently Asked Questions
What is bitcoin dominance in simple terms?
Bitcoin dominance is the share of total crypto market value that sits in Bitcoin. If you picture the whole crypto market as one pie, dominance is how large Bitcoin’s slice is. It is a market-share figure, not the price of one bitcoin and not a mood score.
How is bitcoin dominance calculated?
Market cap for a coin is price times circulating supply. Dominance is Bitcoin’s market cap divided by the total market cap the chart includes, multiplied by 100. A worked example, not a live reading: if Bitcoin’s market cap were 1 unit and the counted total were 2 units, dominance would be 50 percent. Real charts use live market data, which this page does not quote.
What is BTC.D?
BTC.D is the common ticker for a bitcoin dominance chart, especially on TradingView. It is the same idea packaged as a line you can watch over time. TradingView describes a coin’s dominance as its market cap divided by the market cap of the top 125 coins, then multiplied by 100. Other sites may use a wider or narrower set of assets.
What does rising bitcoin dominance usually mean?
The share is getting larger. That can happen because Bitcoin’s market cap is rising faster than the rest, or because other coins are falling harder, or both. It does not, by itself, say whether you should buy Bitcoin or anything else.
What does falling bitcoin dominance usually mean?
Bitcoin’s slice is shrinking relative to whatever the chart counts. Other coins, including stablecoins on some indexes, may be taking a larger share. Bitcoin’s own price can still be rising if those other assets are rising faster.
Can Bitcoin’s price rise while dominance falls?
Yes. Price is the value of one bitcoin. Dominance is Bitcoin’s share of a wider total. If the rest of the market grows faster than Bitcoin, the share falls even while the bitcoin price rises. The reverse is also possible: price down, share up, if other coins drop more.
Is bitcoin dominance a buy signal?
No. It is one descriptive ratio. Traders sometimes watch it beside price, but a rising or falling line is not an instruction to buy, sell, or rotate into other coins. This page is education only, not a recommendation.
Why do websites show different dominance figures?
They choose different baskets. One index may include a broad set of tokens and stablecoins. Another, such as the TradingView description of BTC.D, uses the top 125 coins. Supply definitions and delayed prices also move the result. Compare the method before you compare the percentage.
Is looking at bitcoin dominance a tax event in Australia?
No. Reading a market-share chart does not dispose of an asset. Australian tax questions usually start when you actually sell, swap, or spend crypto, or receive it as income. This guide does not calculate anyone’s tax. Check the ATO or a registered tax agent for your own situation.
Is bitcoin dominance the same as the Fear and Greed index?
No. Dominance is market share. A fear index tries to summarise sentiment. They can be discussed in the same week of news and still answer different questions. See our separate news note on a fear-index reading; this glossary does not restate that story.
Related Guides

Bitcoin Rewards Australia: How Aussies Earn BTC in 2026
How Australians earn BTC through cashback cards, apps, browsers, referrals and exchange programs, plus custody checks, ATO tax basics and Jittie’s learn-and-earn education.

Crypto Staking Australia: 2026 Education Guide
Crypto staking in Australia explained for 2026: how proof-of-stake rewards work, liquid vs locked vs exchange earn products, ATO income vs CGT treatment, and the main risks. Education only.

What Is a Crypto Exchange in Australia? 2026 Guide
What a crypto exchange is in Australia, how AUSTRAC registration works, how AUD on-ramps work, and how a centralised exchange differs from a DEX, a Bitcoin ATM and an ASX bitcoin ETF.
Jittie Editorial Team
Crypto Education Specialists
Our team of crypto experts and financial educators are passionate about making cryptocurrency accessible to all Australians. With backgrounds in blockchain technology, finance, and education, we create clear, accurate guides to help you navigate the crypto world safely.